Learn how to view the number of times and for how long a participant has watched event streams.
To be covered:
Intro
Live stream traffic analytics is a powerful tool to give you insights about who visited the stream, how many times they viewed it, and the time span spent watching the live stream.
This data will be available from the moment participants visit the Streams page on your Brella event. You can export stream traffic data per stream or all together at once at any time. You will receive three files which include, visitors, interactions, and activity.
Export data per stream
- Navigate to the Admin Panel - Content
- Click on Streams.
- And then click on Analytics.
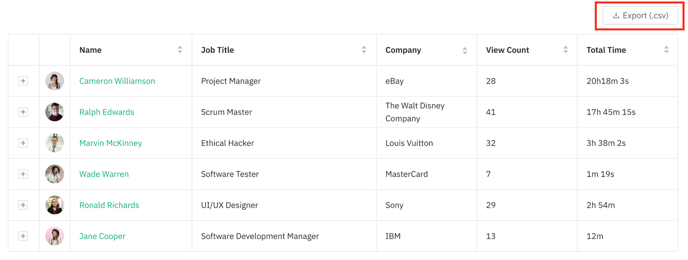
- There scroll down and click on Export (.csv). The data is exported in CSV format.
Export all stream traffic data
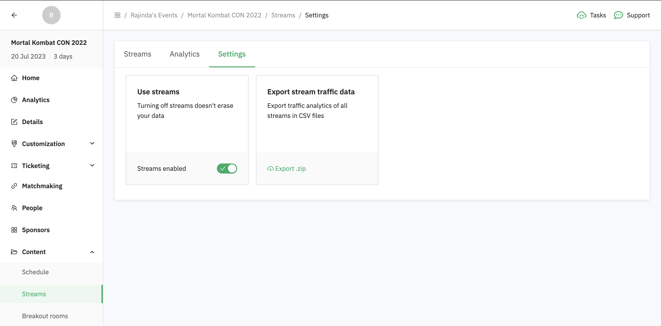
- Navigate to the Admin Panel - Content
- Click on Streams.
- Select Settings,
- Under Export stream traffic data - click on Export zip.
- You will receive three separate files:
-
- Stream name visitors.csv - includes all the total interactions per visitor.
id
email
first_name
last_name
job_title
company
content_title
view_count
duration_seconds (total time)
* This file will show interactions done since the event creation and post-event.
- Stream name interactions. csv - includes all the visitors' interactions combined.
id
email
first_name
last_name
job_title
company
content_title
url
interaction (time_spent)
start_time
end_time
duration_seconds (total time per interaction)
type
* This file will show interactions done since the event creation and post-event.
- Stream name activity. csv - includes all the visitors' activity with the stream.
date
* This file will only show event dates and will start tracking activity as soon as a participant watches the streams.
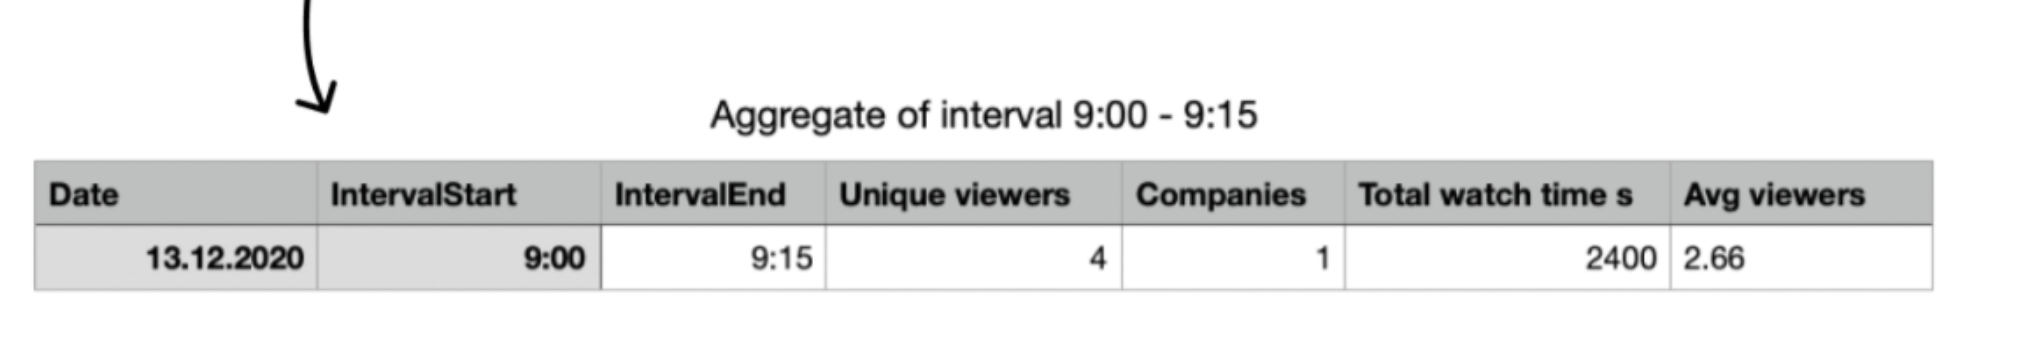
interval_start = it happens every 15 mins)
interval_end
unique_viewers = people who have viewed the stream at least for 2 secs
companies
total_watch_time = all time watched in secs whether is one or + viewers
avg_viewers*
total_view_count
- Stream name visitors.csv - includes all the total interactions per visitor.
💡 *The avg viewer is probably the closest measure of actual attendance at any given point. It is calculated by dividing the Total Watch Time by all watchers on the interval duration (15 minutes). So, if two people watch half of the interval, you get one avg viewer. For example, suppose Peter watched the first half and Patrick watched the second half. In that case, the amount of viewers at any given point is 1, while if they both only watched the first half, the attendance would first be two and then 0 for the second half of the interval, also averaging 1.
Another example: If you see that on your results are Avg viewers are 2.66, it could mean that two people watched the entire 15-minute interval and a third person watched for 10 minutes, or there were more viewers (the unique viewer count), but they didn’t stick so long.
⭐ Tip: To understand the stream and session traffic data definitions please visit this article.
Last updated - July 2023.
Written by Rajinda Wijetunge.

If you didn't find an answer to your questions, please get in touch with the Support Team here.
👇