Learn how to analyze which session was the most popular through views
To be covered:
Intro
Enabling traffic analysis will give you information about how a session that has material added in the streaming section of a content slot was received by the event attendees. You will be able to gather important visitor details and evaluate the performance of such sessions. This feature will be even more important if a streaming session is sponsored because this gives you the ability to share visitor details with the sponsors as well.
Enable traffic analytics
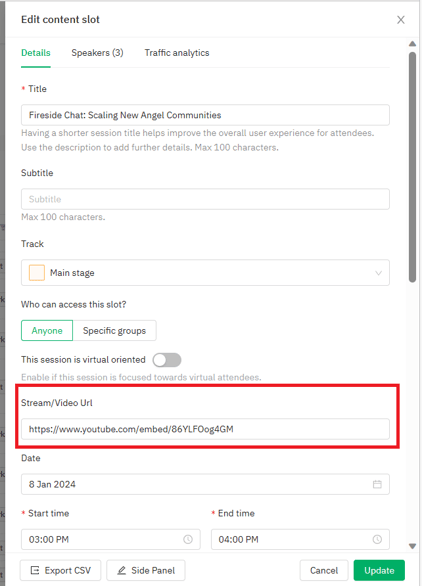
Enable session traffic analytics by filling in the Stream/Video URL category with a link in the content slot. It has to be an embedded link with any content. For instance, a recorded video, an image, a pdf, presentation slides, a page, a post, a survey, etc.
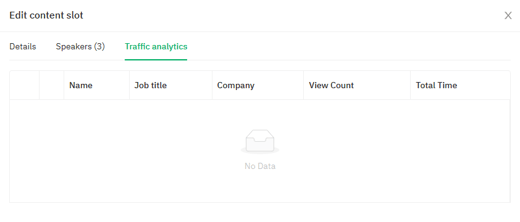
👉 By enabling traffic analytics, you'll have a better understanding of:
- Who viewed the session?
- How long participants spent in the session
- When participants visited the session
⭐ Tip! Understand your schedule session traffic analytics in detail here.
👉 You can add this link at different stages of the setup of your event:
- When creating the Schedule content slots for the first time
- Before launching the event to your audience
- Just before the event starts.
👉 Where to add the Stream/Video URL category?
- Navigate to the Admin panel - Schedule Tab.
- Select the content slot by clicking on Edit.
- Navigate to Details, and add the link to the right category.
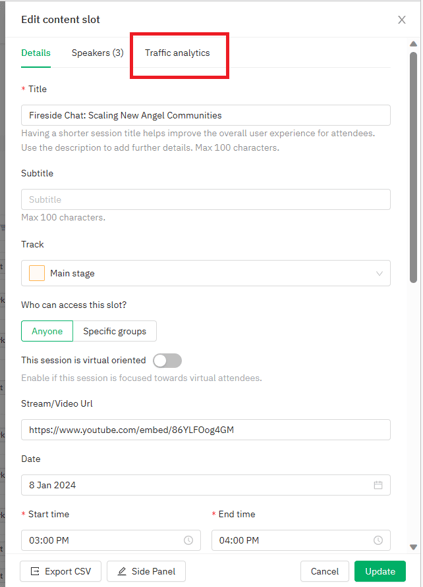
You can view the traffic analytics of a particular session in the same way as explained above by clicking on the traffic analytics tab.
Last updated - June 2023.
Written by Nisansala Wijeratne.

If you didn't find an answer to your questions, please get in touch with the Support Team here.
👇