Learn how to navigate through overall performance and booth visits metrics on overview board on sponsor.brella.io
To be covered:
Intro
The sponsor booth metrics allow the sponsor to keep track of who has visited the booth during the event and what type of content they viewed in the sponsor booth.
Overall performance
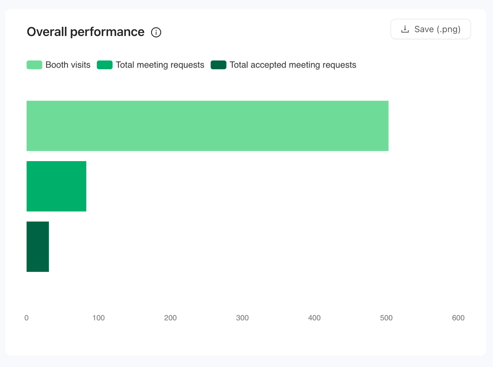
This section displays the Total booth visits vs. Total meeting requests vs. Total accepted. The chart uses quantitative figures at the bottom for the number of visits, meeting demands, and accepted meetings:
- Booth visits: Visitors that click your booth. Light green/top bar
- Total meeting requests: Number of all meeting requests sent between sponsor reps and attendees- Medium green/middle bar
- Total accepted meeting requests: Number of accepted meeting requests between sponsor reps and attendees. Dark green/Lower bar.
Booth visits activity
The booth visit activity chart displays the total visits and unique visitors along with a time range that can be established from the date selector at the bottom of the graph.
To understand better what it refers to on each axis, check the information below:
- Y-axis (left): Number of visits (# of times the booth was accessed).
- X-axis: Date - this could vary according to when the platform was accessible for participants, but as default, it marks the event start and end date.
- Y-axis (right): Number of unique visitors
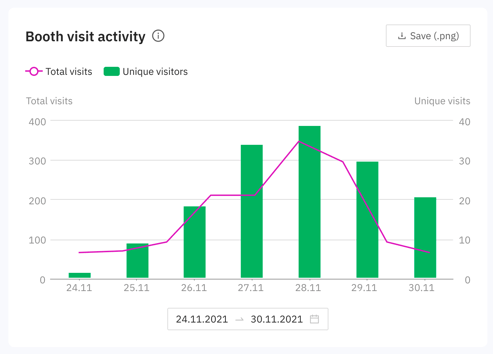
👉 When hovering the mouse on top of the graph, it'll show the exact number of visits or visitors
💡 Tip: Use the maximize icon next to the 'Save' button to view the graph in full-screen mode.
![]()
Tooltips & Save
- Tooltips are info icons placed next to the titles to provide some background information about the graphs that include links to Help Center articles to guide you on the current feature or what is being explained in the dialog box.
- The 'Save' (as image) button is on the right side of the charts and graphs; it will enable you to download the image to your device.
Last updated on July 2023.
Written by Rajinda Wijetunge.

If you didn’t find an answer to your questions, please contact the Support Team here.