Learn how to view engagement & new attendees metrics
To be covered
Intro
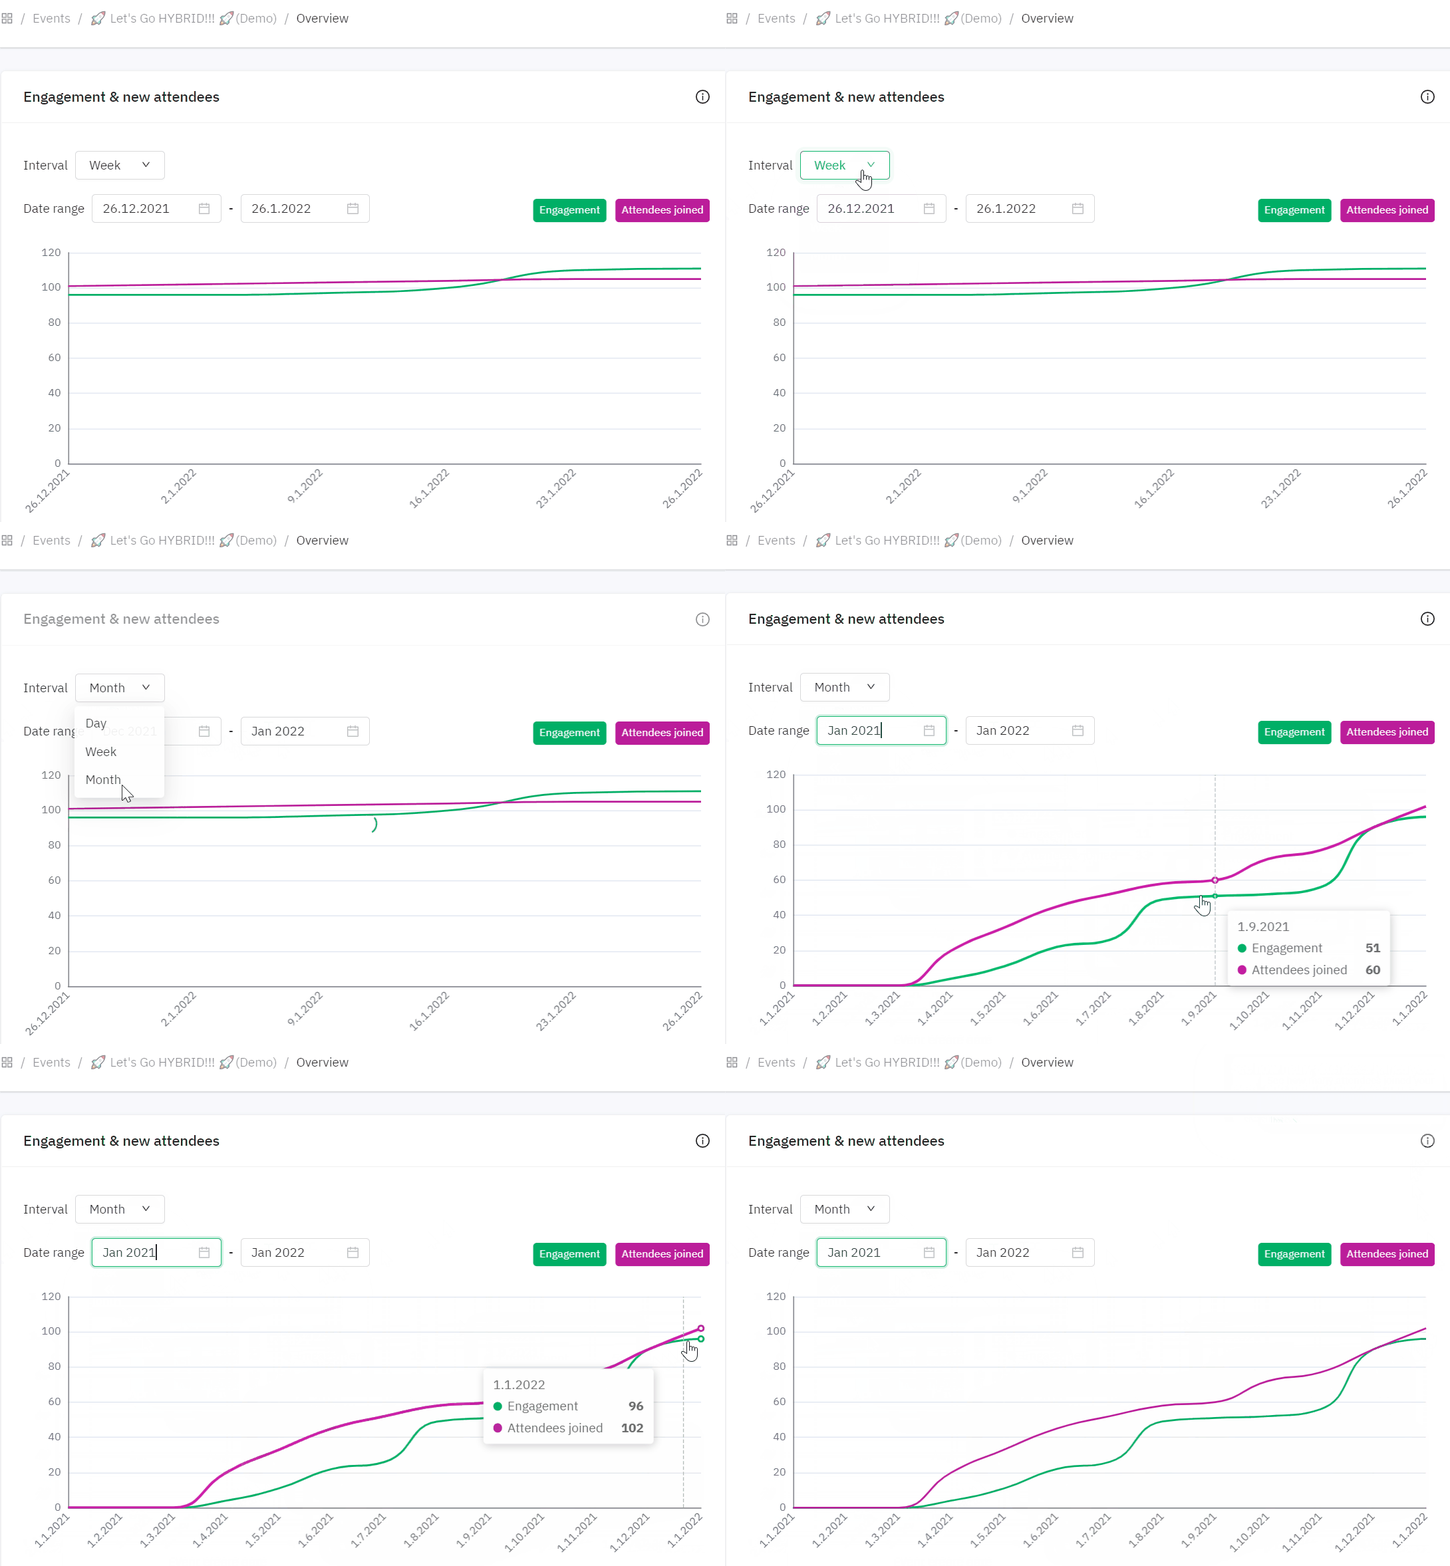
The engagement & new attendees chart shows at what point there was a high or low attendee registration volume and total engagement simultaneously. In summary, it shows how actively your attendees are joining & interacting in Brella over time. As default, the timeline will start once the event is created until the event end date specified on the Admin Panel.
You can also set a different time range per day, week, or month if necessary to visualize the data in sections using the 'Interval' and 'Date range' filters at the top-left of the graph.
- The green trend line shows the total engagement at a certain point of the event.
- The bright pink trend line shows the total of attendees who have joined the event so far.
How to read the data
- Navigate to the admin panel - your event - home - scroll down to this segment.

In the graph above, you can see that the engagement line is above the number of attendees who joined the event. This is normal as the sum of engagement actions increases as the event progresses.
Most of the attendees join closer to the event day, so a graph like the above is common where attendees joined ten days before the first day of the event while the engagement line picks up one day before the actual start date of the event (25.11.2020).
You can select different views and select times Month, Week, and Day to see the graph for the whole event or only a specific duration.
Last updated - August 2023.
Written by Nisansala Wijeratne.

If you didn't find an answer to your questions, please get in touch with the Support Team here.
👇
