Learn how to understand the traffic analytics to sponsor booths.
To be covered
- Intro
- Sponsor Traffic Analytics
- Link is being tracked in the virtual booth (carousel & sidebar)
- Learn how participants engaged with a virtual booth (carousel)
- Carousel links tracked in a virtual booth
Intro
This article will walk you through the admin panel's sponsor booth traffic analytics dashboard, which also applies to the exported raw data.
Before looking into the sponsor's traffic analytics, it's vital to understand what Brella tracks:
- Brella tracks participant's interactions (views only) in a booth before and during the event.
- To understand who visited a booth during the event and which booth is most popular, export the traffic data and analyze participants' interactions per stream and per date and time.
Sponsor Traffic Analytics
1. Navigate to the 'Traffic Analytics' page through a sponsor's profile in the Sponsor Tab
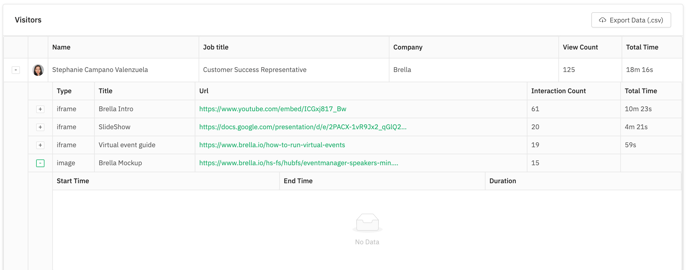
2. Review the list of all the attendees who visited and interacted with this specific booth.
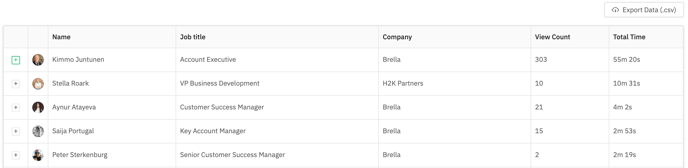
At first glance, you'll see the Name, Job Title, company, View Count, and Total Time.
These metrics tell you how popular a Sponsor's virtual booth was:
-
View count is the total number of times this person clicks on an item (image or video/stream/pdf, etc.) located in the virtual booth's carousel section.
-
Total time is the full time this person spent in this virtual booth.
The View Count and Total Time are not correlated.
Since the View count is the number of times, a person clicks on the page of the item, including if you kept the session page open in the background, the total time only includes the number of times you spent watching the page of the item.
How to see what link is being tracked in the virtual booth (carousel & sidebar)
- To expand the details click '+' to the left of the attendees image
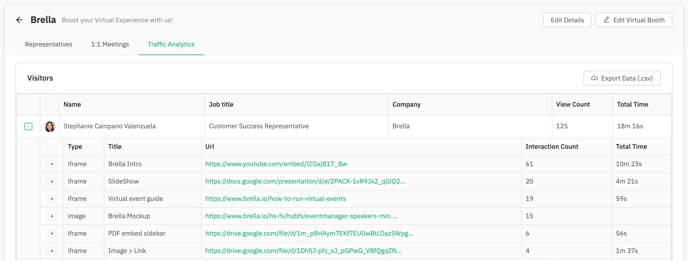
There you'll see new subjects for each item. At first glance, you see the Type, Title, Url, Interaction Count, and Total Time.
- Type is the type of link you added to the booth.
- Title is the name you gave to this link when adding it to the booth in the carousel.
- Url is the link you added.
- Interaction Count is the number of times this attendee clicked on an item in the carousel.
- Total Time is the total time he spent watching this session/page.
Learn how participants engaged with the virtual booths
Here you'll see:
- the times (frequency) they watched the virtual booth and
- the duration of each session, they watched a specific item of the booth
Click on the '+' icon next to the specific item
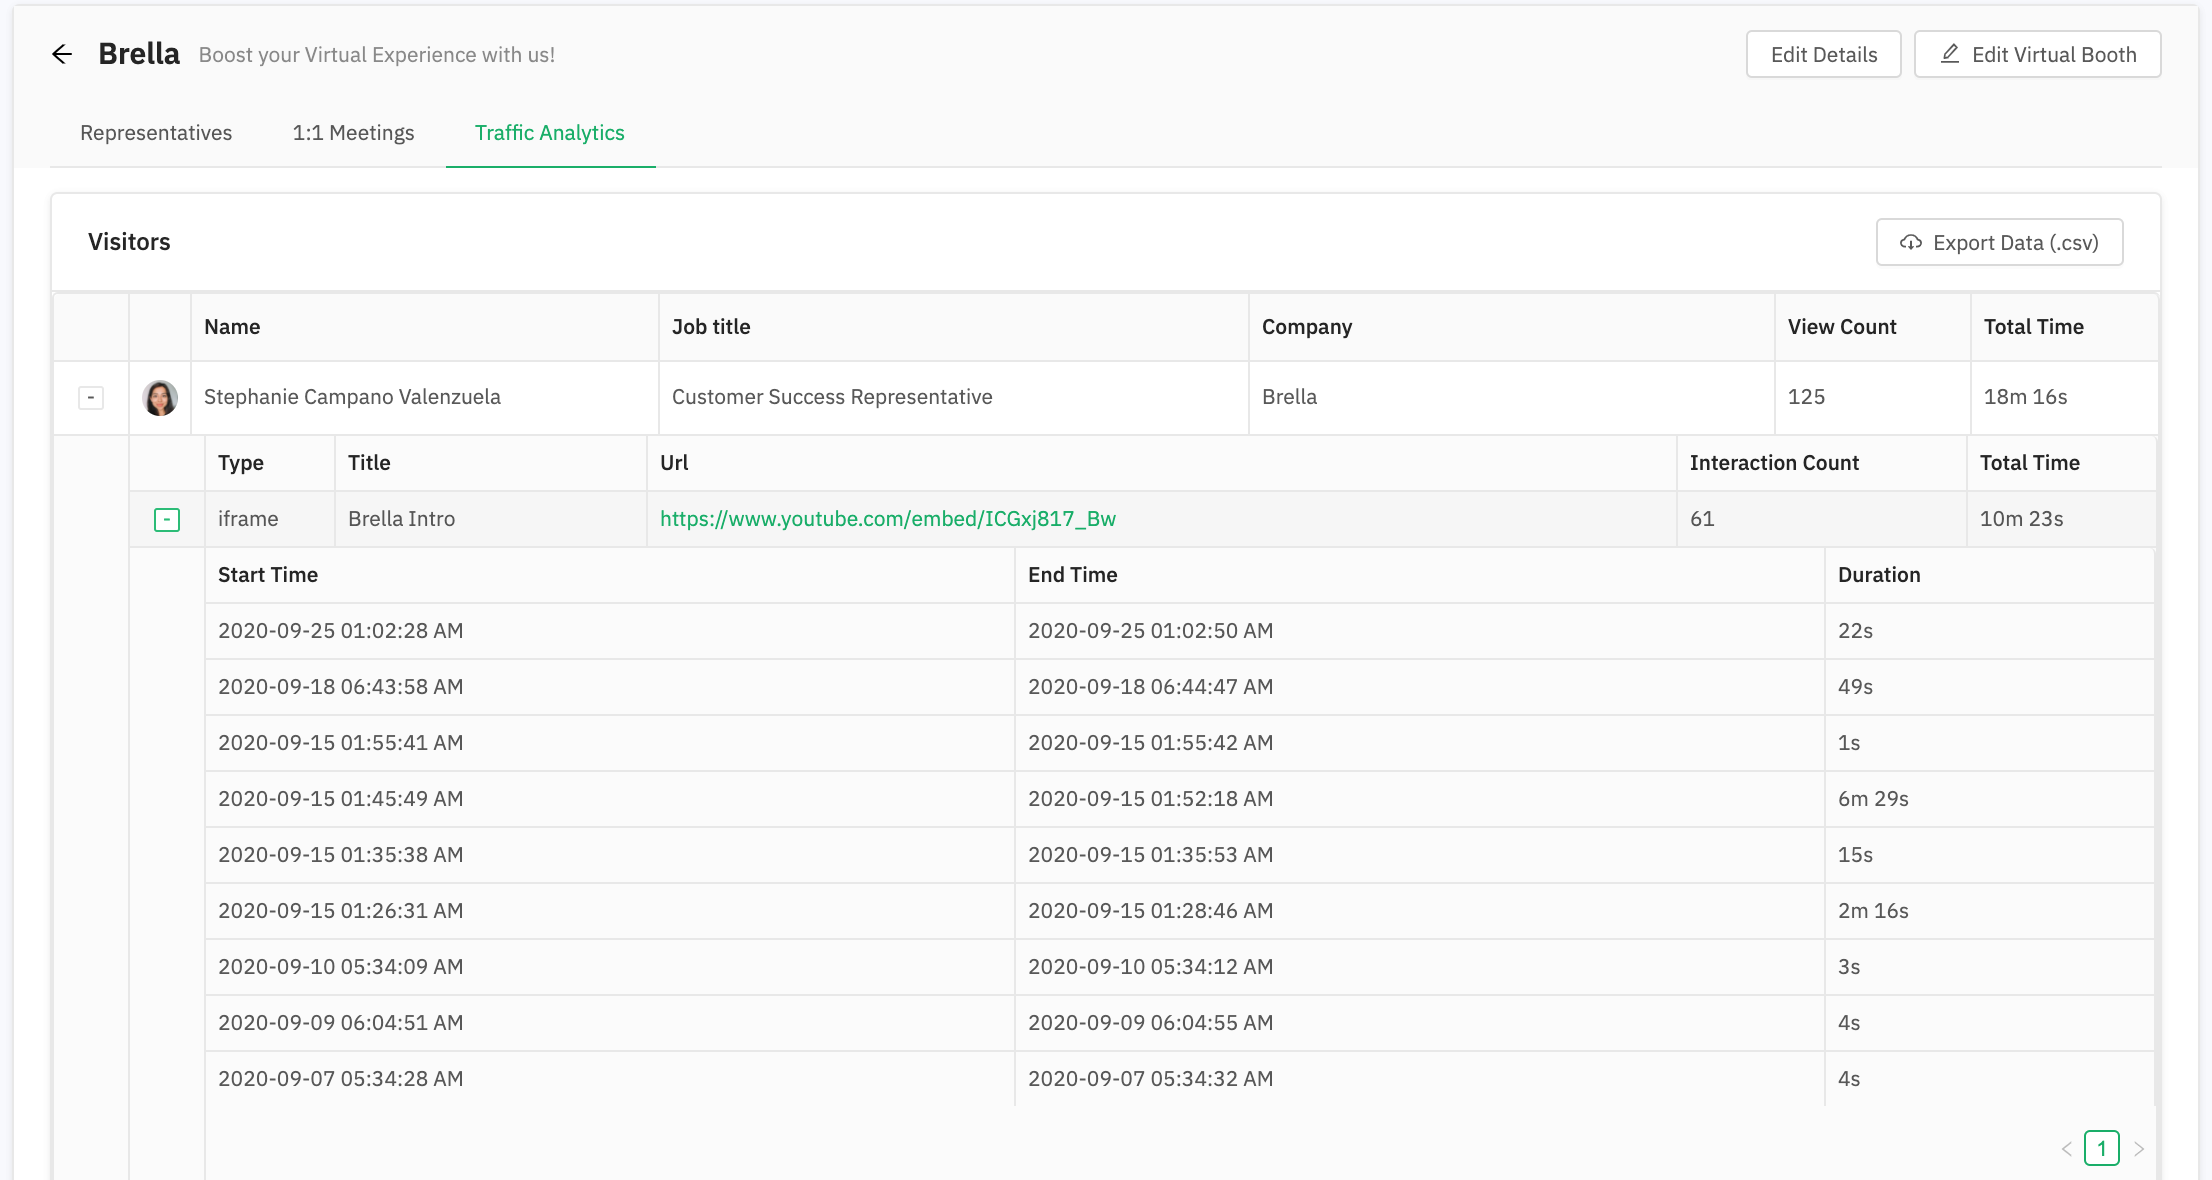
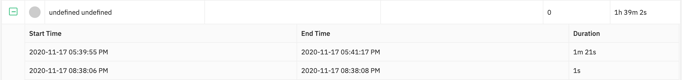
At first glance, you'll see Start Time, End Time, and Duration.
-
Start Time is the time they started a new session after clicking on the specific page in the virtual booth and the time started running.
-
End Time is the time they closed the page (session) after clicking outside of the page and the time stopped running.
-
Duration is the total time between the start time and end time.
Carousel links tracked in the virtual booth
Currently, all the traffic analytics of the virtual booth is only tracking the carousel links.
❗The sidebar integrations iframe is not being tracked.
An embedded video, pdf, stream, presentation, a web page's traffic will be tracked in the booth.- The 'Interaction Count' will summarize the total number of times someone clicks it on this item's page. While the 'Total Time' will only include the total time this person spent watching this item's page.
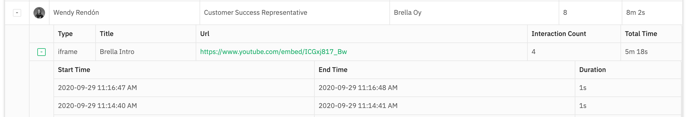
👉Note! If the 'End Time' shows 'Invalid Date,' this person is currently watching this item.
- The 'Interaction Count' will summarize the total number of times a participant clicks it on this item's page. While the 'Total Time' will not be tracked. E.g., on the image above, the category 'Type' > image > Brella Mockup has only interaction count tracked.
🔍 Important! If you see 'undefined' in the Name list, this means an attendee has been removed from the event in the admin panel, or s/he has deleted her account.
🚨Can't you see data in the Traffic Analytics tab? To see data in the Virtual Booths, you need to add content to the Carousel section on the Admin Panel
Last updated - July 2022.
Written by Natasha Santiago.

If you didn't find an answer to your questions, please get in touch with the Support Team here.
👇