Learn how to navigate through the overview tab and understand your virtual booth and meetings' performance on sponsor.brella.io
To be covered:
Intro
The Overview tab offers you a compact resume of your performance at the event in real-time. This tab contains sections with highlighted information according to the virtual booth and representatives' meeting activities.
Hot to (Steps)
- Navigate to the event at manager.brella.io.
- Go to "Sponsors".
- Select each sponsor one at a time.
- Click "Overview"
- You will find all related information in this section.
Board Navigation
- Tooltips and 'Save' - buttons that help you to learn what each view entails, and enable you to export the graphs.
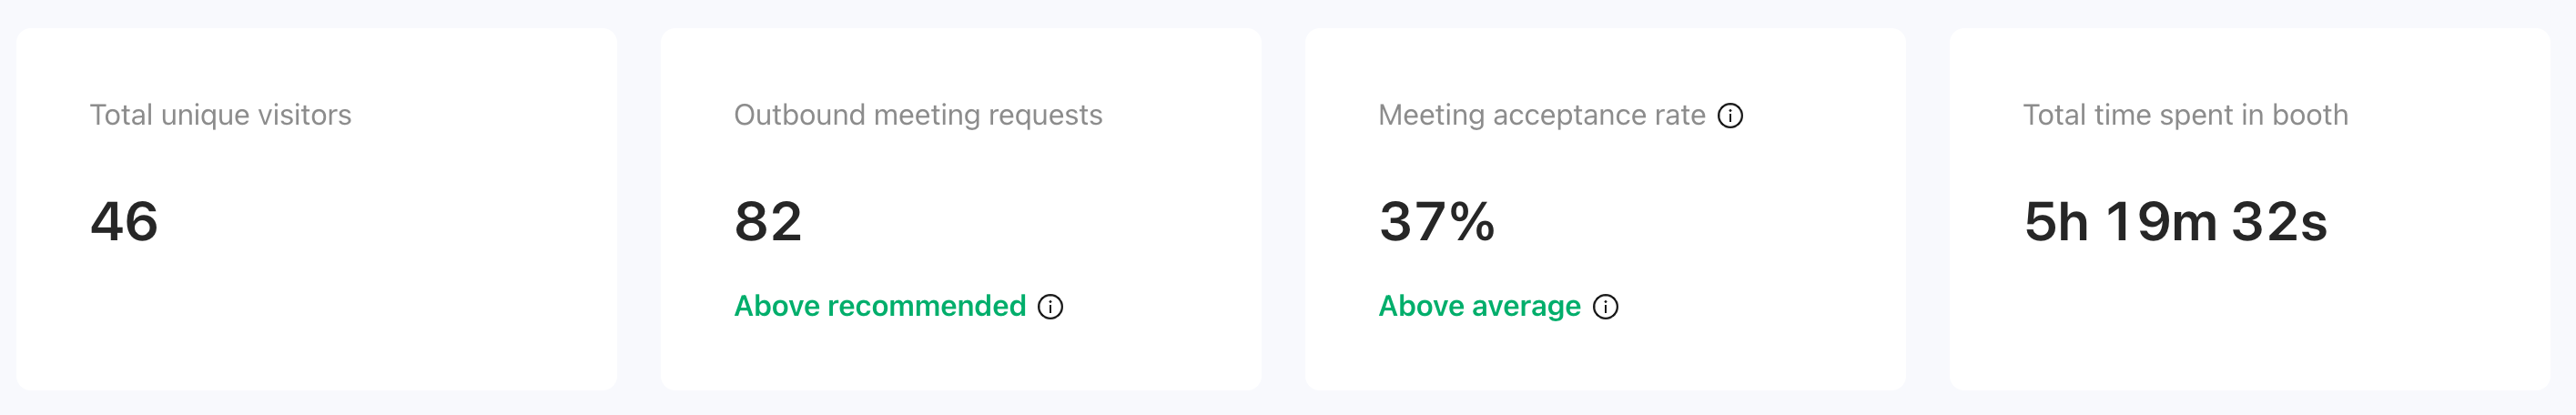
- Highlights bar - displays the Total unique visitors, Outbound meeting requests, Meeting acceptance rate, and Total time spent in the booth. This can help you understand where you need to improve in terms of event performance in a glance:
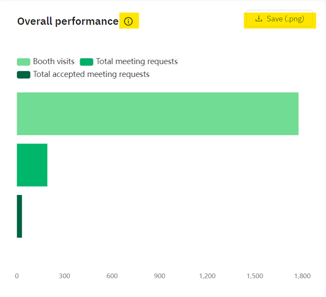
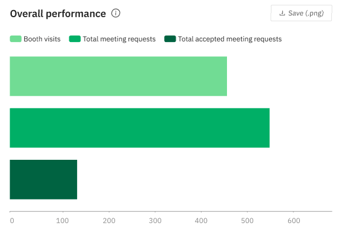
- Overall performance - graph for booth visits, total meeting requests, and total accepted meetings. This can help you to visualize whether the demand (visits & and requests) and offer (accepted meetings) match; if not, make sure to take actions to balance the curve:
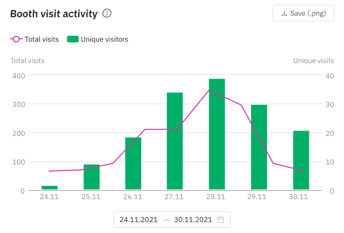
- Booth visit activity - bar graph of total visits vs. unique visitors, helps you to visualize the traffic of visitors daily:
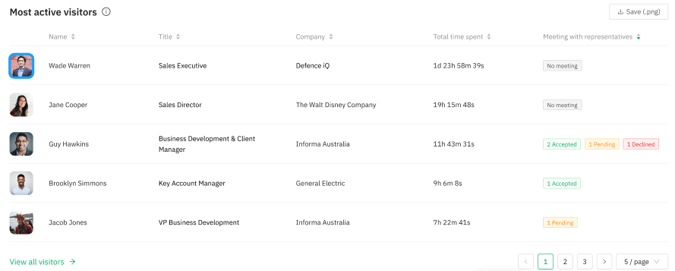
- Most active visitors - table that displays the attendees who interacted with your booth on next.brella.io. This table can help you to find potential prospects through the list of people who engage and spend time in your booth the most, excluding representatives:
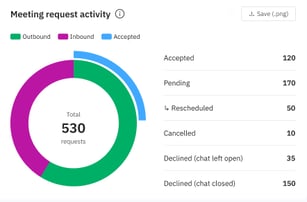
- Meeting request activity - pie chart for Outbound, Inbound, and Accepted meetings. Make sure to take action if demand (inbound) is higher than offer (accepted). Always send more outbound requests, as this is your direct ROI:
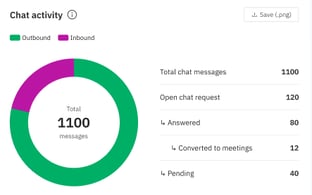
- Chat activity - pie chart for requested, answered, pending, and total exchange of 1:1 messages at the event:
⚡ Important: If the traffic analytics table is not available in your view, it might not be part of your sponsorship. Hence, address this matter with your event organizer if you'd like to get access to such data.
🌟 Tip: All analytics and graphics can be exported from sponsor.brella.io using the 'Save' or 'Export' buttons from the Overview, Representatives, Engagement, Traffic Analytics, and Prospects tabs!
Last updated on July 2023.
Written by Purnima Jayasuriya.

If you didn’t find an answer to your questions, please contact the Support Team here.