- Help Center
- I am an Event Organizer
- 📖 Home Analytics
-
I am an Event Organizer
- 📖 Getting Access
- 📖 Event Details
- 📖 Customization
- 📖 Ticketing
- 📖 Matchmaking
- 📖 Sponsors
- 📖 Schedule & Widget
- 📖 Attendees & Groups
- 📖 Event Onboarding
- 📖 Speakers
- 📖 Streams
- 📖 Breakout Rooms
- 📖 Event Info Pages
- 📖 Communications
- 📖 Home Analytics
- 📖 Exporting Reports
- 📖 Analytics Tab Overview
- 📖 Traffic Analytics
- 📖 Integrations
- 📖 Troubleshooting
-
I am a Sponsor
-
I am an App User
-
Integrations
-
Login Methods
-
Brella Partners
-
Communities
-
Getting Started with Events
-
Tips for Event Organizers
-
Explore Brella
-
Brella Dictionary
Home Analytics: Average Attendee Engagement
Learn how to read the average attendee engagement data provided by Brella
To be covered:
Intro
Engagement at events is crucial to make people register for future events without hesitation! At Brella, you can see what the engagement rate is per attendee. Let us see how to understand this data.
How to understand the data
To learn what the average engagement rate is per attendee:
- Navigate to the admin panel - your event - Home
- On the upper side, you will see the image below. 👇
The higher the Av. engagement rate, the better your event is performing in terms of Engagement. Based on hundreds of Brella events, we found out that an average engagement of 14 is good! 👍 If you go above, your team rocks! 🏆
| View for in-person/virtual events |
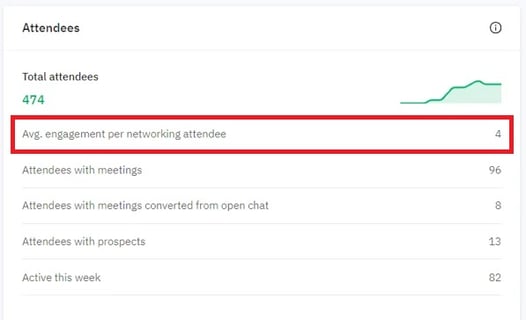 |
| View for Hybrid events |
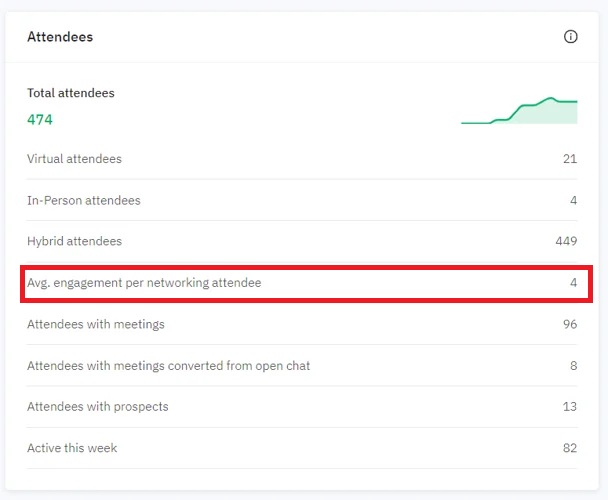 |
👉Av. attendee engagement formula:
(Total engagement / Total attendees with meetings) = X
- Total Engagement = Chat messages (all messages) + Meeting requests (all meeting types: accepted, pending, etc.)
- Total Attendees with meetings = Users with meetings.
Best wishes from the Brella team for a successful event!
Last updated - February 2024.
Written by Rajinda Wijetunge.

If you didn't find an answer to your questions, please get in touch with the Support Team here.
👇